Home » News & Events » What are the Profiles of Wind Development in the Five Leading Countries?
What are the Profiles of Wind Development in the Five Leading Countries?
The world's five leading countries in terms of installed wind power capacity are: Germany, Spain, United States, Denmark and India.
Germany: The installed wind power capacity was 48 MW in 1990. It increased to 12 GW in 2002, the largest amount of installed capacity in the world. According to industry associations, installed capacity increased to 16.6 GW in 2004.7 Electricity production from wind turbines was 18.5 TWh in 2003, more than 3% of Germany's electricity production. Industry sources estimate electricity production at 22.6 TWh in 2004.
One-third of the world's installed wind power is in Germany. In 2002 there were about 16 000 wind turbines, mostly situated in northern Germany near the border with Denmark.
The impetus for the German wind power market was the 100 MW Programme initiated in 1989, which was expanded to 250 MW in 1991. This programme provided grants as well as remuneration under the Electricity Feed-in Law. The 1991 Feed-in Law is considered the driving force behind the rapid increase in wind power in Germany. It provided renewable energy producers up to 90% of the retail price of electricity for every kWh generated. The Renewable Energy Sources Act 2000 further strengthened market deployment by providing an incentive production payment for the first five years of operation followed by a decreasing output payment in subsequent years. Investment support provides up to 80% of total investment costs at low interest rates. Rapid deployment of wind power is also attributed to changes in codes that awarded wind farms the same legal rights as fossil and nuclear power plants.
Wind turbines are largely connected to the grid at low and medium voltages. With the advent of the feed-in tariffs in 1991 and the spurt of wind developments that followed, the transmission system operators had concerns about grid integration reliability and cost issues. They looked to the government for a solution. The Renewable Energy Sources Act 2000 consequently provided for a burden sharing between all network operators and allocation to their customers. This solution is estimated to currently add about €12 per year to the average household electricity bill. The significant growth of onshore wind power led to collaboration between the transmission system operators and German research institutions to develop advanced forecasting and modelling tools for wind power. Subsequently, the expected extension offshore led to a more fundamental review of grid extension and upgrade needs, which culminated in a joint research effort between German research institutions, grid operators and the electricity supply industry. German researchers are also significantly involved in international and European research programmes on grid integration matters.
The German Government has a target of 20% share of renewable energy in electricity generation between 2015 and 2020. Most of this is expected to come from wind power. Concerns about network integration and infrastructure capacity to accommodate some 37 GW of wind power by 2015 were the impetus for a federal government and industry joint-financed report released in February 2005, “Energy Planning for the Integration of Wind Energy in Germany on Land and Offshore into the Electricity Grid”. It finds that reinforcement and extension of the grid and technical solutions for reliability are preconditions for achieving the envisaged wind power development and avoiding 20 to 40 million tons of CO2 emissions in 2015. It would entail about 850 kilometres of new high-voltage lines and 400 km of grid upgrades at an estimated cost of €1.1 billion. The study cautions that implementation could be stymied by the planning and legal authorisation process for transmission lines. The study suggests that the additional cost for the expansion of wind power will be 0.39 – 0.49 € cents per kWh in 2015 for a residential consumer.
Spain: The installed wind power capacity was 2 MW in 1990. It increased to 4.8 GW in 2002, the second largest in the world. According to industry associations, installed capacity increased to 8.2 GW in 2004. Electricity production from wind turbines was 11.5 TWh in 2003. Industry sources estimate electricity production at 14 TWh in 2004, about 4% of Spain's electricity production.
Strong growth is attributed to local manufacturing of turbines and policy support through feed-in tariffs and low-interest loans. An important impetus has come from regional governments that support the construction of factories and the creation of local jobs. Three Spanish companies are among the world's ten largest manufacturers of wind turbines. Favourable lending arrangements, in which banks guarantee the cash flow of the project thereby reducing risks, have been very effective in increasing wind power.
The incentive structures have favoured large wind developments that are connected to the high voltage transmission network. Weak grid infrastructure in some areas has inhibited the development of wind farms. This led to a comprehensive review of transmission and distribution requirements by the grid operator, which is concerned about system impacts from more large-scale wind farms and the costs of integration. At present, Spain's transmission system interconnections with neighbouring countries are weak so opportunities afforded through power pools are limited.
United States: The installed wind power capacity was 1 911 MW in 1990. It increased to 4.4 GW in 2002, the third largest in the world. According to industry associations, installed capacity increased to 6.7 GW in 2004. Electricity production from wind turbines was 11.5 TWh in 2003.
Wind power experienced two distinct periods of growth in the United States. The Public Utility Regulatory Act (PURPA) in 1978 required utilities to offer long-term power purchase contracts to private power developers that were based on the utilities' avoided generation costs. There were also federal and state tax incentives. Most of the early development occurred in California where utilities had high marginal costs.
In the late 1990s there was a second period of growth spurred by a combination of federal tax incentives and policies adopted in several states, e.g., renewables portfolio standards. The new generation of wind turbine technology available by then further supported the interest of utilities. In Texas nearly 1 000 MW of wind power development were installed in 2001, in part to meet the state's renewable energy portfolio standard. Voluntary green power marketing programmes have also encouraged wind power developments, which represent a significant share of the green power sold in the United States. One of the federal incentives, the production tax credit (PTC) dating back to 1992, has been allowed to expire several times. Its on-again - off-again nature has resulted in boom-and-bust cycles for new installed capacity. The PTC was revived late in 2004 and set to expire at the end of 2005, which therefore is expected to be a record year for newly installed capacity.
To date, intermittency, per se, has not been an obstacle to wind projects in the United States. Wind power developments have been largely in remote areas and connected to high voltage transmission networks. However, access to transmission networks and pricing for intermittent resources has been a hurdle. In 2004, the Federal Energy Regulatory Commission proposed modifications in the wholesale electricity market structure that would eliminate penalties associated with wind's variable output when it does not result in increased costs to the system. This proposal is currently under consideration.
With significant growth anticipated, the wind energy and electric power industries, research institutions and the federal government are working collaboratively to address issues related to the integration of larger amounts of wind power, including co-joining wind farms with hydropower plants. As an example of this type of innovation and integrated resource management, in 2002 the Bonneville Power Administration (BPA) undertook an extensive R&D effort to evaluate the costs and opportunities associated with integrating wind energy into the federal Columbia River hydropower system. In May 2004, BPA launched two new services that will use the flexibility of the hydro system to integrate wind energy into its control area on behalf of electric utilities in the US Pacific Northwest region.
Denmark: The installed wind power capacity was 343 MW in 1990. It increased to 2.9 GW in 2002, the fourth largest in the world. Wind turbine capacity represented 21.8% of Denmark's electricity supply in 2002. According to industry associations, installed capacity increased to 3.1 GW in 2004, but only 2 MW were added that year. Offshore capacity was 214 MW in 2002, up from 50 MW in 2001.
Electricity production from wind turbines was 5.5 TWh in 2003, about 16% of Denmark's electricity production. Industry sources estimate electricity production at 6.6 TWh in 2004, about 19% of electricity production. In Denmark, each MW of capacity produces an average of 2 129 MWh a year – much more than the world average.
Denmark has successfully and flexibly employed both demand pull and technology push policy instruments to achieve its wind power targets. For example, the Risø National Laboratory established a test station in 1978 for wind turbines that was responsible for type approvals that were a precondition for obtaining plant and production subsidies. Risø functioned as a technological service centre for the nascent Danish wind turbine industry, whose individual companies at that point did not have the resources to undertake technological development. Government RD&D has been directed towards basic research rather than actual turbine or component development and had enjoyed a relatively stable level of support.
The technological developments led to significant growth in demand for wind turbines in the 1990s in both domestic and export markets. Within Denmark, the technological advances were coupled with market deployment strategies building on a policy combination of feed-in tariffs and subsidies for installation costs. Utilities were required to connect private wind turbines to the grid. An agreement was established between utilities, government and wind turbine owners in the early wind power development period. Among other features, it established the grid connection rules, and particularly who should pay. Grid integration costs are paid by the network and allocated to all customers.
The Danish Government supported wind to help achieve energy goals and other policy objectives, e.g., industrial development and rural employment. Investments were made in RD&D and learning in a niche market to improve technology cost and performance. Through the development years, the Danish state financed the additional costs involved. Following liberalisation of the electricity market and reflecting the maturing of the wind power technology, the economic commitment shifted to consumers. The support scheme is being reorganised and following a transition period, wind turbines will have to produce on market terms, but with a bonus that capitalises on the environmental and societal benefits of wind power.
Denmark has the highest penetration of wind power in its electricity supply systems of any country. About 93% of the wind generation is fed into the distribution networks. Wind farms in Denmark are generally small clusters in the 10-20 MW range and are widely dispersed across the country, which means lower volatility of output in the short-term and therefore less need for balancing power. With this profile, the variations in output are less than for very large and isolated wind farms and therefore more manageable for network operators. In addition, wind power in combination with combined heat and power generation, which is widespread in Denmark, provides some of the needed power regulation flexibility as the district heating systems can be used as a short-term energy buffer. As well, the Danish transmission system has strong interconnections with Germany and the Nordic countries and participation in the Nordpool power market is an important means for selling excess capacity and purchasing additional balancing power as and when needed. Danish network operators, utilities, government and research institutions are active in international and European collaborative research on grid integration matters.
India: According to the India Wind Association, the installed wind power capacity was 30 MW in 1990. It increased to 2 117 MW in 2002, the fifth largest in the world. Installed capacity increased to 3 000 MW in 2004.
The first wind power development was a government supported demonstration plant in 1986. India had notable wind power developments by the late 1990s, largely due to incentives such an accelerated depreciation allowance of capital costs and exemptions from excise duties and sales taxes, and regionally administered feed-in tariffs. A tax rebate of 80% on the income from power generation for the first ten years of operation has encouraged commercial investment, as has the attraction of power supply for use in businesses. Since the first demonstration plant, some 2 052 MW of installed wind capacity has beendeveloped by commercial interests. In some cases they are not well integrated as the wind turbines produce more power that the weak distribution system can handle.
The government Centre of Wind Energy Technology (C-WET) in Chennai is a specialised institution for research and development, standardisation, testing and certification, along with resource assessment. Risø National Laboratory provided technical assistance for its establishment.
With rapid growth in wind power development in the 1990s, the capacity of the grids in the wind farm regions in Tamil Nadu and Gujarat was insufficient to accommodate the wind power. It caused frequent outages of the grid and reduced the return from the wind farms. In 1998, Risø and C-WET collaborated on a research project to study wind power integration in weak grids in India.
India has developed indigenous wind energy equipment manufacturing with a capacity of about 1 000 MW per year.
Germany: The installed wind power capacity was 48 MW in 1990. It increased to 12 GW in 2002, the largest amount of installed capacity in the world. According to industry associations, installed capacity increased to 16.6 GW in 2004.7 Electricity production from wind turbines was 18.5 TWh in 2003, more than 3% of Germany's electricity production. Industry sources estimate electricity production at 22.6 TWh in 2004.
One-third of the world's installed wind power is in Germany. In 2002 there were about 16 000 wind turbines, mostly situated in northern Germany near the border with Denmark.
The impetus for the German wind power market was the 100 MW Programme initiated in 1989, which was expanded to 250 MW in 1991. This programme provided grants as well as remuneration under the Electricity Feed-in Law. The 1991 Feed-in Law is considered the driving force behind the rapid increase in wind power in Germany. It provided renewable energy producers up to 90% of the retail price of electricity for every kWh generated. The Renewable Energy Sources Act 2000 further strengthened market deployment by providing an incentive production payment for the first five years of operation followed by a decreasing output payment in subsequent years. Investment support provides up to 80% of total investment costs at low interest rates. Rapid deployment of wind power is also attributed to changes in codes that awarded wind farms the same legal rights as fossil and nuclear power plants.
Wind turbines are largely connected to the grid at low and medium voltages. With the advent of the feed-in tariffs in 1991 and the spurt of wind developments that followed, the transmission system operators had concerns about grid integration reliability and cost issues. They looked to the government for a solution. The Renewable Energy Sources Act 2000 consequently provided for a burden sharing between all network operators and allocation to their customers. This solution is estimated to currently add about €12 per year to the average household electricity bill. The significant growth of onshore wind power led to collaboration between the transmission system operators and German research institutions to develop advanced forecasting and modelling tools for wind power. Subsequently, the expected extension offshore led to a more fundamental review of grid extension and upgrade needs, which culminated in a joint research effort between German research institutions, grid operators and the electricity supply industry. German researchers are also significantly involved in international and European research programmes on grid integration matters.
The German Government has a target of 20% share of renewable energy in electricity generation between 2015 and 2020. Most of this is expected to come from wind power. Concerns about network integration and infrastructure capacity to accommodate some 37 GW of wind power by 2015 were the impetus for a federal government and industry joint-financed report released in February 2005, “Energy Planning for the Integration of Wind Energy in Germany on Land and Offshore into the Electricity Grid”. It finds that reinforcement and extension of the grid and technical solutions for reliability are preconditions for achieving the envisaged wind power development and avoiding 20 to 40 million tons of CO2 emissions in 2015. It would entail about 850 kilometres of new high-voltage lines and 400 km of grid upgrades at an estimated cost of €1.1 billion. The study cautions that implementation could be stymied by the planning and legal authorisation process for transmission lines. The study suggests that the additional cost for the expansion of wind power will be 0.39 – 0.49 € cents per kWh in 2015 for a residential consumer.

Spain: The installed wind power capacity was 2 MW in 1990. It increased to 4.8 GW in 2002, the second largest in the world. According to industry associations, installed capacity increased to 8.2 GW in 2004. Electricity production from wind turbines was 11.5 TWh in 2003. Industry sources estimate electricity production at 14 TWh in 2004, about 4% of Spain's electricity production.
Strong growth is attributed to local manufacturing of turbines and policy support through feed-in tariffs and low-interest loans. An important impetus has come from regional governments that support the construction of factories and the creation of local jobs. Three Spanish companies are among the world's ten largest manufacturers of wind turbines. Favourable lending arrangements, in which banks guarantee the cash flow of the project thereby reducing risks, have been very effective in increasing wind power.
The incentive structures have favoured large wind developments that are connected to the high voltage transmission network. Weak grid infrastructure in some areas has inhibited the development of wind farms. This led to a comprehensive review of transmission and distribution requirements by the grid operator, which is concerned about system impacts from more large-scale wind farms and the costs of integration. At present, Spain's transmission system interconnections with neighbouring countries are weak so opportunities afforded through power pools are limited.
United States: The installed wind power capacity was 1 911 MW in 1990. It increased to 4.4 GW in 2002, the third largest in the world. According to industry associations, installed capacity increased to 6.7 GW in 2004. Electricity production from wind turbines was 11.5 TWh in 2003.
Wind power experienced two distinct periods of growth in the United States. The Public Utility Regulatory Act (PURPA) in 1978 required utilities to offer long-term power purchase contracts to private power developers that were based on the utilities' avoided generation costs. There were also federal and state tax incentives. Most of the early development occurred in California where utilities had high marginal costs.
In the late 1990s there was a second period of growth spurred by a combination of federal tax incentives and policies adopted in several states, e.g., renewables portfolio standards. The new generation of wind turbine technology available by then further supported the interest of utilities. In Texas nearly 1 000 MW of wind power development were installed in 2001, in part to meet the state's renewable energy portfolio standard. Voluntary green power marketing programmes have also encouraged wind power developments, which represent a significant share of the green power sold in the United States. One of the federal incentives, the production tax credit (PTC) dating back to 1992, has been allowed to expire several times. Its on-again - off-again nature has resulted in boom-and-bust cycles for new installed capacity. The PTC was revived late in 2004 and set to expire at the end of 2005, which therefore is expected to be a record year for newly installed capacity.
To date, intermittency, per se, has not been an obstacle to wind projects in the United States. Wind power developments have been largely in remote areas and connected to high voltage transmission networks. However, access to transmission networks and pricing for intermittent resources has been a hurdle. In 2004, the Federal Energy Regulatory Commission proposed modifications in the wholesale electricity market structure that would eliminate penalties associated with wind's variable output when it does not result in increased costs to the system. This proposal is currently under consideration.
With significant growth anticipated, the wind energy and electric power industries, research institutions and the federal government are working collaboratively to address issues related to the integration of larger amounts of wind power, including co-joining wind farms with hydropower plants. As an example of this type of innovation and integrated resource management, in 2002 the Bonneville Power Administration (BPA) undertook an extensive R&D effort to evaluate the costs and opportunities associated with integrating wind energy into the federal Columbia River hydropower system. In May 2004, BPA launched two new services that will use the flexibility of the hydro system to integrate wind energy into its control area on behalf of electric utilities in the US Pacific Northwest region.
Denmark: The installed wind power capacity was 343 MW in 1990. It increased to 2.9 GW in 2002, the fourth largest in the world. Wind turbine capacity represented 21.8% of Denmark's electricity supply in 2002. According to industry associations, installed capacity increased to 3.1 GW in 2004, but only 2 MW were added that year. Offshore capacity was 214 MW in 2002, up from 50 MW in 2001.
Electricity production from wind turbines was 5.5 TWh in 2003, about 16% of Denmark's electricity production. Industry sources estimate electricity production at 6.6 TWh in 2004, about 19% of electricity production. In Denmark, each MW of capacity produces an average of 2 129 MWh a year – much more than the world average.
Denmark has successfully and flexibly employed both demand pull and technology push policy instruments to achieve its wind power targets. For example, the Risø National Laboratory established a test station in 1978 for wind turbines that was responsible for type approvals that were a precondition for obtaining plant and production subsidies. Risø functioned as a technological service centre for the nascent Danish wind turbine industry, whose individual companies at that point did not have the resources to undertake technological development. Government RD&D has been directed towards basic research rather than actual turbine or component development and had enjoyed a relatively stable level of support.
The technological developments led to significant growth in demand for wind turbines in the 1990s in both domestic and export markets. Within Denmark, the technological advances were coupled with market deployment strategies building on a policy combination of feed-in tariffs and subsidies for installation costs. Utilities were required to connect private wind turbines to the grid. An agreement was established between utilities, government and wind turbine owners in the early wind power development period. Among other features, it established the grid connection rules, and particularly who should pay. Grid integration costs are paid by the network and allocated to all customers.
The Danish Government supported wind to help achieve energy goals and other policy objectives, e.g., industrial development and rural employment. Investments were made in RD&D and learning in a niche market to improve technology cost and performance. Through the development years, the Danish state financed the additional costs involved. Following liberalisation of the electricity market and reflecting the maturing of the wind power technology, the economic commitment shifted to consumers. The support scheme is being reorganised and following a transition period, wind turbines will have to produce on market terms, but with a bonus that capitalises on the environmental and societal benefits of wind power.
Denmark has the highest penetration of wind power in its electricity supply systems of any country. About 93% of the wind generation is fed into the distribution networks. Wind farms in Denmark are generally small clusters in the 10-20 MW range and are widely dispersed across the country, which means lower volatility of output in the short-term and therefore less need for balancing power. With this profile, the variations in output are less than for very large and isolated wind farms and therefore more manageable for network operators. In addition, wind power in combination with combined heat and power generation, which is widespread in Denmark, provides some of the needed power regulation flexibility as the district heating systems can be used as a short-term energy buffer. As well, the Danish transmission system has strong interconnections with Germany and the Nordic countries and participation in the Nordpool power market is an important means for selling excess capacity and purchasing additional balancing power as and when needed. Danish network operators, utilities, government and research institutions are active in international and European collaborative research on grid integration matters.

India: According to the India Wind Association, the installed wind power capacity was 30 MW in 1990. It increased to 2 117 MW in 2002, the fifth largest in the world. Installed capacity increased to 3 000 MW in 2004.
The first wind power development was a government supported demonstration plant in 1986. India had notable wind power developments by the late 1990s, largely due to incentives such an accelerated depreciation allowance of capital costs and exemptions from excise duties and sales taxes, and regionally administered feed-in tariffs. A tax rebate of 80% on the income from power generation for the first ten years of operation has encouraged commercial investment, as has the attraction of power supply for use in businesses. Since the first demonstration plant, some 2 052 MW of installed wind capacity has beendeveloped by commercial interests. In some cases they are not well integrated as the wind turbines produce more power that the weak distribution system can handle.
The government Centre of Wind Energy Technology (C-WET) in Chennai is a specialised institution for research and development, standardisation, testing and certification, along with resource assessment. Risø National Laboratory provided technical assistance for its establishment.
With rapid growth in wind power development in the 1990s, the capacity of the grids in the wind farm regions in Tamil Nadu and Gujarat was insufficient to accommodate the wind power. It caused frequent outages of the grid and reduced the return from the wind farms. In 1998, Risø and C-WET collaborated on a research project to study wind power integration in weak grids in India.
India has developed indigenous wind energy equipment manufacturing with a capacity of about 1 000 MW per year.
Post a Comment:
You may also like:
Featured Articles
Economic Impacts of Wind Industry
 Any business development will have economic impacts on the local and regional economies, and wind energy projects are no ...
 Any business development will have economic impacts on the local and regional economies, and wind energy projects are no ...
Environmental Impacts of Wind Industry
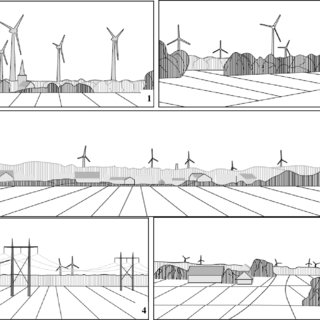 In recent years, the growth of capacity to generate electricity from wind energy has been extremely rapid, To the ...
 In recent years, the growth of capacity to generate electricity from wind energy has been extremely rapid, To the ...
Challenges in Wind Industry
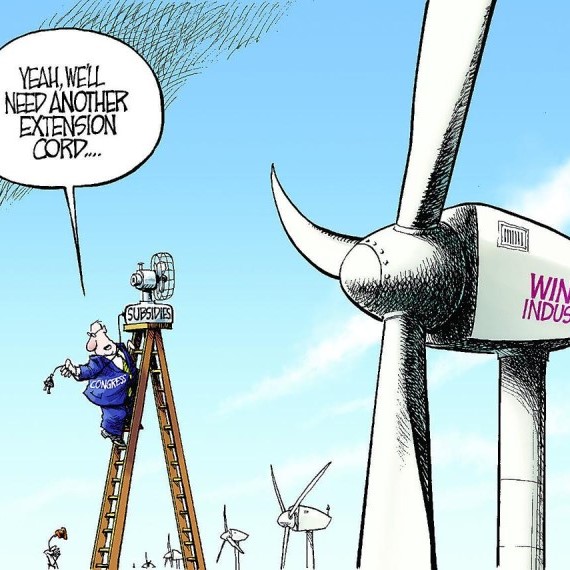 While wind power generation offers numerous benefits and advantages over conventional power generation, there are also some ...
 While wind power generation offers numerous benefits and advantages over conventional power generation, there are also some ...
Wind Energy Cost Trends
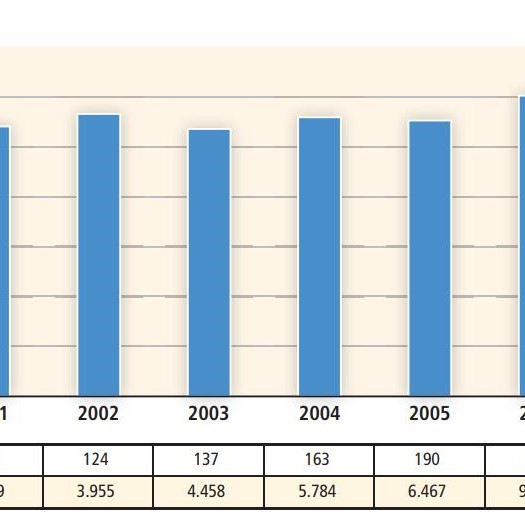 Though the cost of wind energy has declined significantly since the 1980s, policy measures are currently required to ensure ...
 Though the cost of wind energy has declined significantly since the 1980s, policy measures are currently required to ensure ...
Employment Impacts of Wind Industry
 As with most construction and commercial development, wind energy industry create jobs. According to the 2016 Clean Jobs New ...
 As with most construction and commercial development, wind energy industry create jobs. According to the 2016 Clean Jobs New ...